Where did the Tyne's nurdles go? What our modelling shows
Most of the plastic pellets spilled into the Tyne in July were carried out to sea. But even after allowing for what clean-up teams recovered, more than two tonnes, around one in eight pellets, were still in the estuary at the end of August. Elevated river flows of the autumn could flush them downstream.
On 19 July 2026, around 17 tonnes of plastic pellets, some 850 million nurdles, were released into the Tyne at the Port of Tyne. Since then, our team at Newcastle University has been reconstructing where they may have gone. We presented this work as advice to the Scientific and Technical Advice Cell (STAC), which advises the organisations managing the incident, on 8 September, and updated it on 16 September.
How we did it
We built a detailed computer model of the tidal Tyne and the neighbouring North Sea. It represents tides, river flow, wind and waves. Before trusting it, we checked it against real measurements: it reproduces the timing and size of the tide at North Shields to within 8 cm on average, and upstream at Gateshead to within 15 cm. Getting the tide right at the coast and far upstream shows the model captures how water moves through the estuary.
We then released 10,000 virtual particles into the modelled currents at the time and place of the spill and followed them for two months. We repeated this with different, equally reasonable descriptions of ocean currents and of how strongly wind pushes floating pellets, to see which conclusions hold up.
What we found
A substantial amount stayed in the river
About 2.2 tonnes, around one in eight pellets, were still in the estuary on 30 August, after allowing for recovery by clean-up teams.
Most were carried out to sea
Pellets began leaving the river on the first day, and by early August most had gone. Every scenario showed the bulk of the material exported offshore.
Exactly where they went at sea
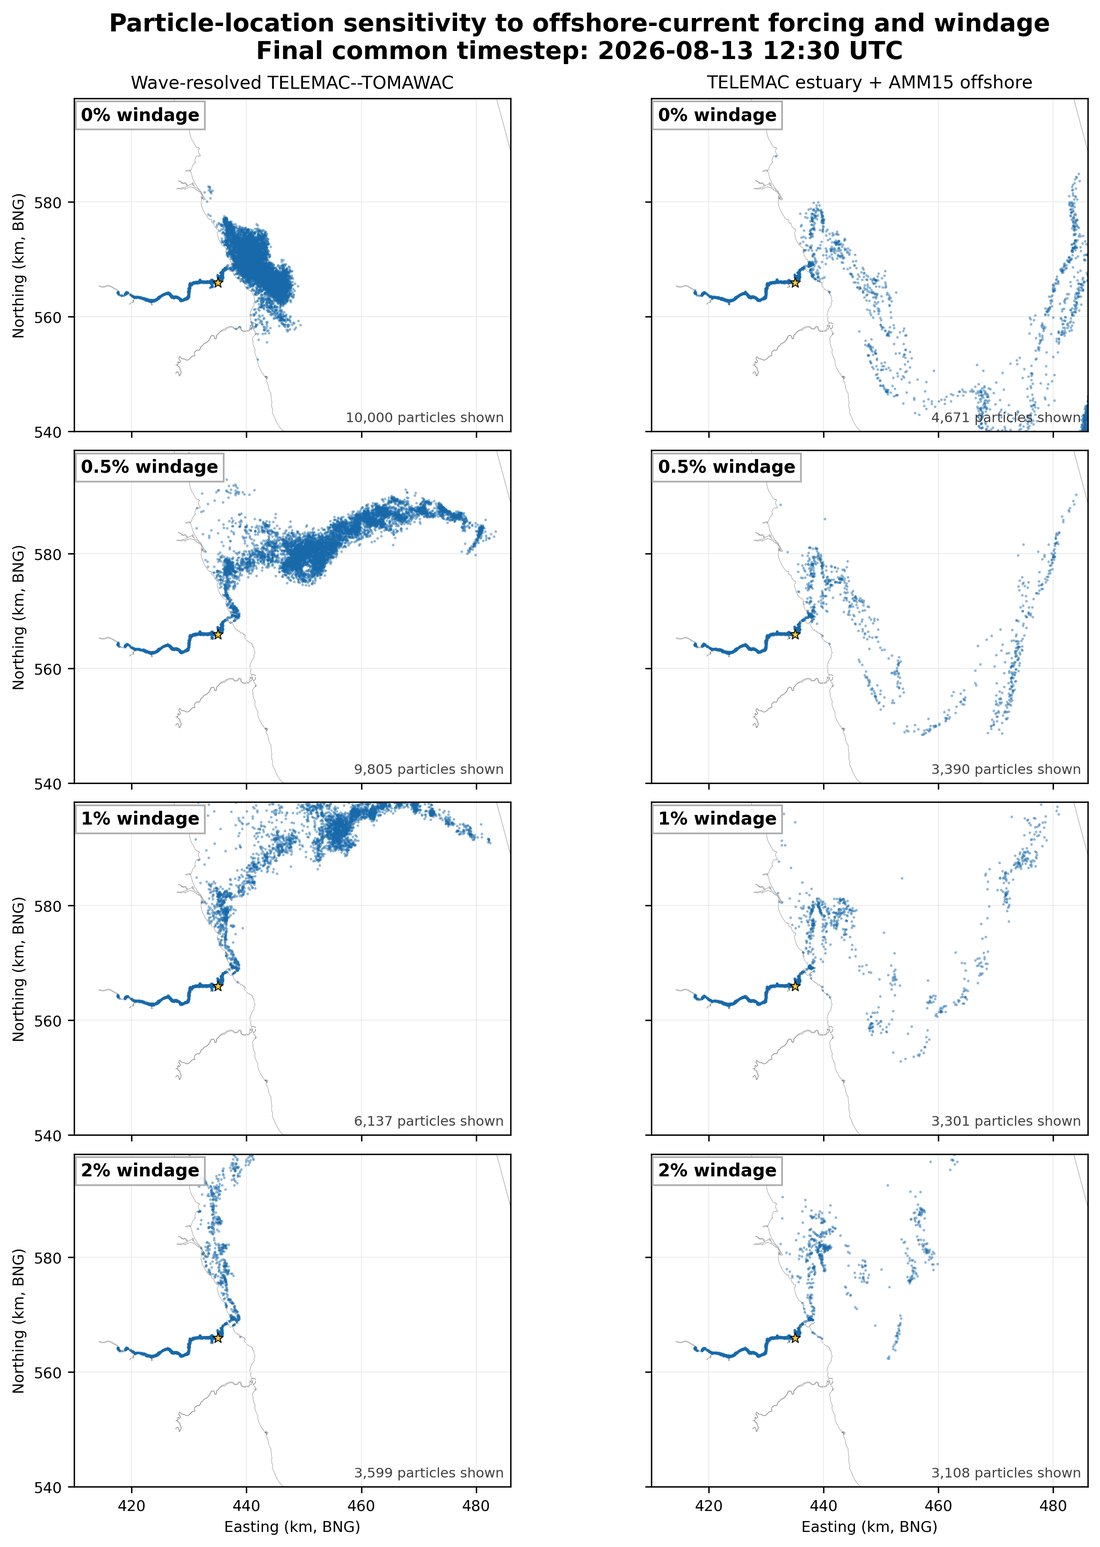
Offshore paths changed markedly between scenarios, so our maps show possibilities, not a record of where pellets went.
How much is still in the river?
After one day, 99% of the virtual pellets were still in the estuary. That fell to about 75% on 27 July and 38% on 3 August. By 30 August, 15.8% remained.
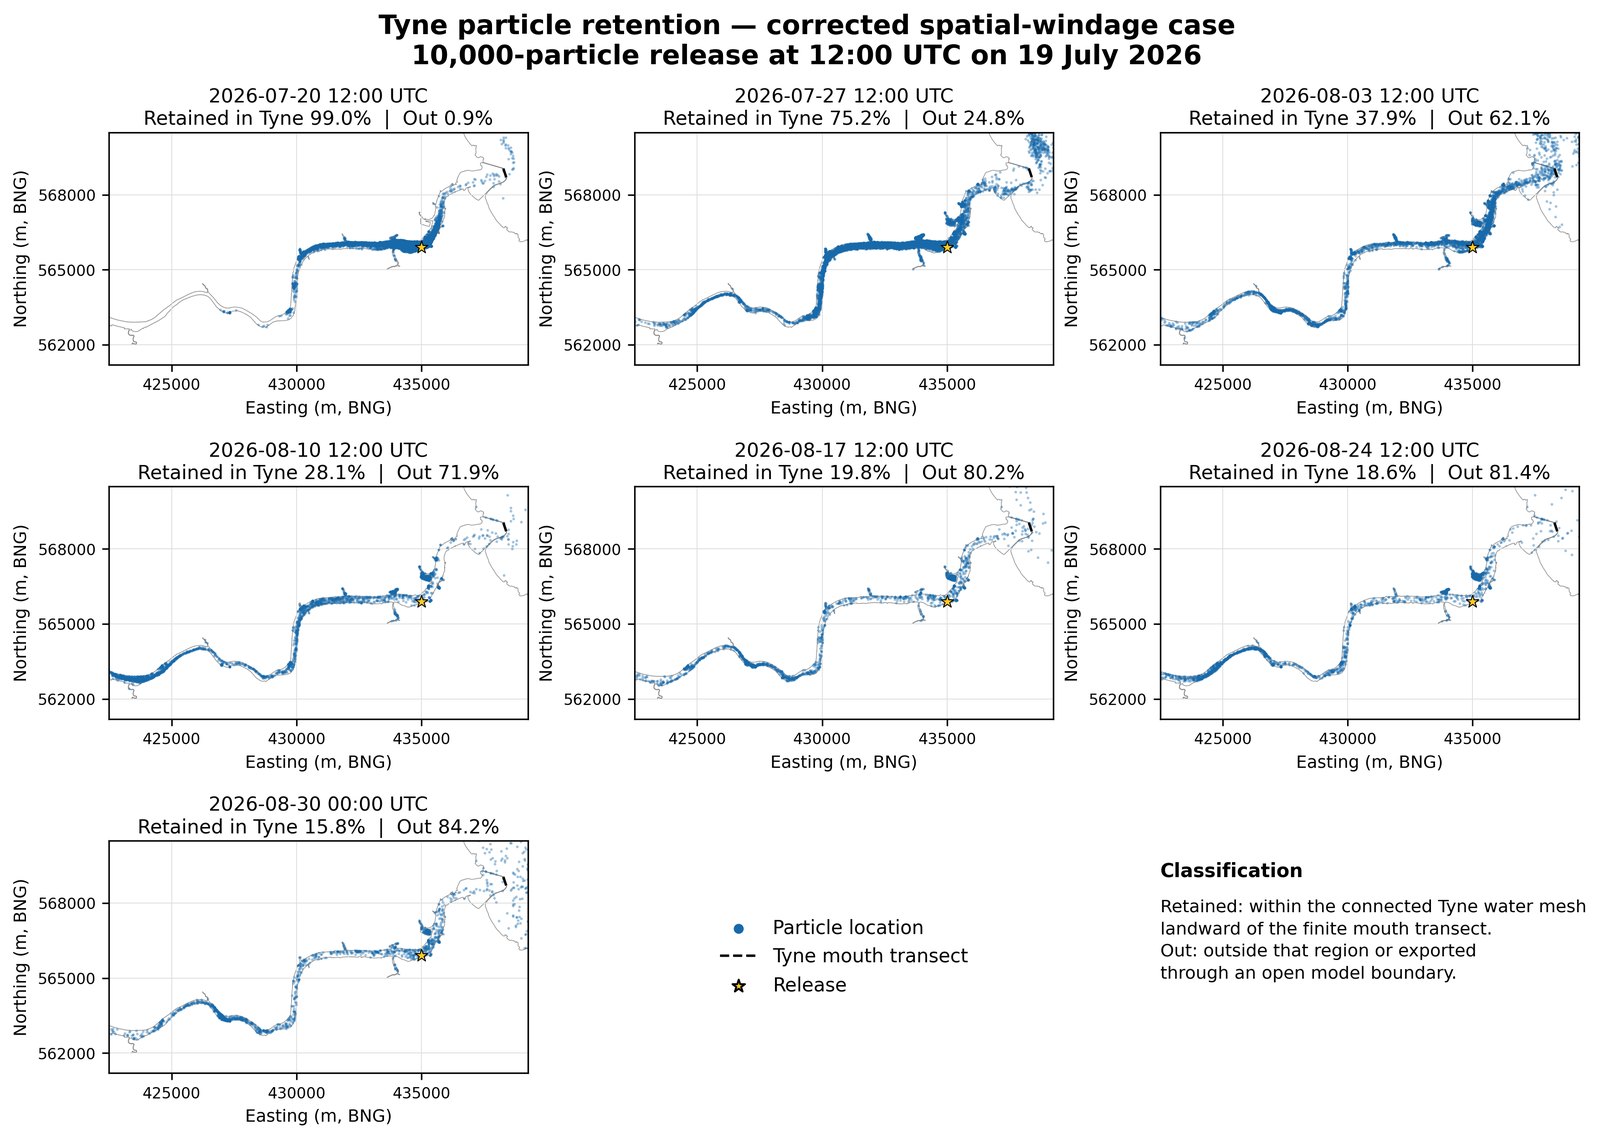
Clean-up teams have recovered pellets from the tidal Tyne since the first days of the response, so we took that into account too. We removed recovered pellets from the model on the dates they were collected, rather than subtracting the total at the end, because some of the pellets collected early on would otherwise have been carried out to sea.
Allowing for recovery, about 2.2 tonnes remained in the Tyne on 30 August: around one in eight of the pellets released. Much of what was recovered early in the response would otherwise have left the estuary by then.
The model lets a pellet that touches the shore stick there for a while before it's washed off again. We deliberately set a low chance of sticking, so the model is more likely to underestimate the pellets held along the banks than to overestimate them.
What this means
A window before the autumn floods. River flows in the Tyne have generally been low from July through to the end of September, so pellets in the estuary have had little to move them on. Significant high-flow events are likely to flush some of them downstream. We strongly recommend that interception, trapping or recovery measures are considered before then, wherever they can be deployed safely and effectively.
This is an inference from the modelling: we haven't yet simulated the effect of high river flows. The amount still in the estuary also supports continued monitoring and recovery there.
Where did they go at sea?
This is much less certain. The animation above shows one plausible scenario, which carries pellets towards northern shores in early August before the offshore cloud shifts south in the following weeks. Its broad pattern appears to fit the large numbers of pellets recovered along the open coast. But that doesn't prove its assumptions are right: recovery records also depend on where people searched, what they could reach and what was reported.
Changing two reasonable assumptions, the description of offshore currents and how strongly the wind pushes floating pellets, changes the direction, distance and spread of the offshore cloud. None of these choices is wrong, and all are grounded in published research, so we treat them as a range of possibilities rather than picking one.
What the model can't tell us
- The model can't say whether pellets were present or absent at a particular beach or riverbank. A modelled absence isn't evidence that no pellets are there, and a modelled arrival doesn't prove pellets were deposited.
- Offshore, the wind's effect on floating pellets matters a great deal. Even a fraction of one per cent of the wind speed adds up to large distances over several weeks.
- We're using a two-dimensional model. A three-dimensional one could show how fresh river water flows over seawater. But without measurements of salinity and currents at different depths in the estuary, its extra detail couldn't be checked, so we aren't running it yet.
How you can help
The most useful evidence for testing the model is where and when pellets have, and haven't, been found, including searches that found nothing. Photos from phones record exactly that. If you've seen nurdles, or looked and found none, please submit an observation.
What's next
We'll next run a large set of related simulations to test the effect of wind, turbulence and shoreline behaviour, and compare them with recovery records. This autumn our NERC-funded fieldwork begins: measuring how pellets move through full tidal cycles, surveying riverbanks with drones and sampling sediments. That will let us test these results directly.
Modelling by Dr Seb Pitman, reviewed by Dr Matt Perks. Models used: TELEMAC-2D and TOMAWAC (water and waves), driven by tides, measured river flows, ERA5 weather and Copernicus offshore waves; OpenDrift (particle tracking), allowing for recovery records from the incident response. This work was presented to STAC on 8 September 2026 and updated on 16 September.